
Remember the goal
Keep the intended job—reach, conversation, consideration, traffic, or conversion—beside each post so success is not chosen after the result arrives.
Social media analytics means using account and post results to understand whether content helped the goal behind it. Emelyn compares similar work, explains the pattern in plain language, and turns it into a keep, try, or stop decision for the next content cycle.
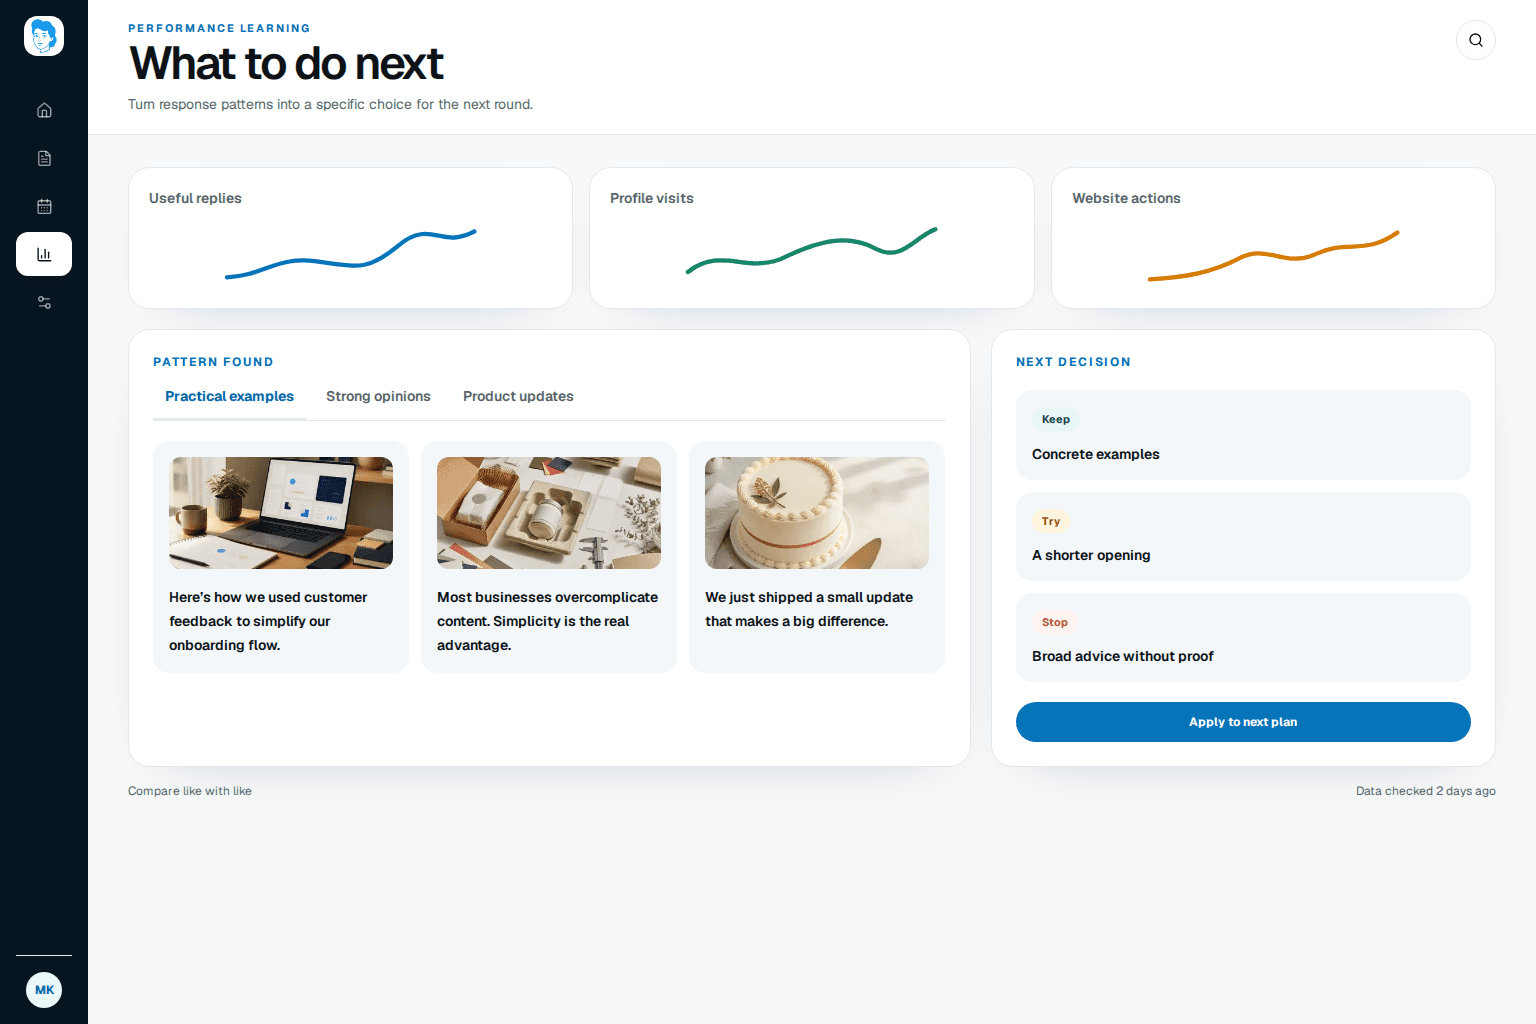
A report can contain every number and still answer nothing. Start with the job of the content, compare it fairly, and decide what the pattern changes.
Keep the intended job—reach, conversation, consideration, traffic, or conversion—beside each post so success is not chosen after the result arrives.
Separate channels, formats, audience sizes, paid distribution, and time windows before deciding that one idea or creative choice worked better.
Keep a strong pattern, try a specific change, or stop work that repeatedly fails its intended job. Carry that choice into the next brief.
Different content jobs need different measures. A broad reach number cannot decide whether a practical guide helped people take the intended next step.
Practical carousels that show the whole process will earn more saves and qualified website visits than short opinion posts. Compare six organic LinkedIn posts over 30 days.
Opinion posts reached more people, but the three process carousels earned a higher save rate and more visits to the related guide. One carousel had incomplete click data after a tracking change.
Keep one process carousel each week, try a clearer first slide, and stop judging educational posts by raw impressions alone. Repair tracking before the next comparison.
A specific change to the next calendar, with the uncertain data kept visible instead of turned into a confident story.
Analytics begins with the purpose set before publication and ends when the learning changes what you create or test next.
Choose the content job, useful signal, comparison group, and observation period before the result arrives.
Bring available account and post metrics together with channel, format, timing, audience, and publishing status.
Find repeated differences while keeping data gaps, delays, and other possible explanations visible.
Write one keep, try, or stop decision into the strategy, idea brief, or calendar and measure it again.
Collection, calculation, and recurring comparisons can be automated. People still decide what the business values and whether the evidence supports a change.
A useful analytics product keeps definitions and caveats clear, then carries the decision back into the work.
| Decision point | Spreadsheet | Scheduler | AI writer | Emelyn |
|---|---|---|---|---|
| Starts with | Exports and a reporting question | Published-post metrics | No performance data | The goal and hypothesis set before publishing |
| Compares | Whatever you build in a sheet | Accounts, posts, and periods | Nothing after creation | Similar work with format, channel, and distribution context |
| Explains uncertainty | You document it | Varies by report | Outside its job | Shows delays, gaps, definition changes, and alternative explanations |
| Ends with | A report and your conclusion | A dashboard or export | A draft | A reviewed keep, try, or stop decision in the next cycle |
Social media analytics is the collection and interpretation of account, audience, content, and outcome data to understand performance and make a better next decision.
Track the smallest set that represents the job of the content. Reach may matter for awareness, saves or meaningful replies for usefulness, clicks for traffic, and reliable downstream actions for conversion. Keep metric definitions and time periods clear.
Tools may update at different times, use different API fields, calculate rates differently, or lack access to some native metrics. Check the definition, source, freshness, and included posts before treating a mismatch as an error.
Use a rhythm that matches your publishing volume and decision. Check delivery problems quickly, review content patterns after enough comparable posts exist, and revisit strategy less often than individual post results.
It can contribute when social activity is connected to trustworthy website, lead, sales, or retention data. Social metrics alone usually cannot prove revenue impact, and attribution should remain clear about gaps and assumptions.
Match one primary measure and one supporting signal to the job of the content.
Compare attributable value with the full cost and label uncertain influence honestly.
Change one choice across comparable posts and make one next decision.
Compare similar posts before turning a broad benchmark into your schedule.
Keep destination and delivery status beside the result.
Add the audience's words and questions to the numerical pattern.
Carry the decision back through ideas, content, and publishing.
Follow learning into a better strategy and next cycle.